
Climate Change Misconceptions
- This topic has 0 replies, 1 voice, and was last updated 2 years, 11 months ago by

 Route_69.
-
AuthorPosts
-
May 18, 2021 at 3:03 pm #195174
I had typed out a lengthy response in the other thread “[U-Tube] Peter Temple on Climate Change Hoax” but I couldn’t post it there for some reason.
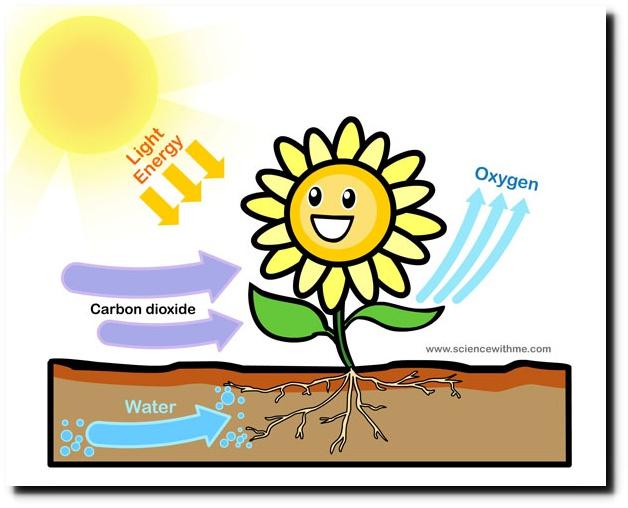

Greenhouse gases are called that because they create a hospitable environment for more vegetation, and the vegetation then absorbs the CO2. So even if CO2 were something that’s bad for the planet, it’s something that has a way of eating itself. And the more vegetation GNGs (greenhouse gases) create, the more CO2 is consumed by said vegetation.
But there are the man made CO2 emissions – so is that a problem? Not according to the ice core samples:
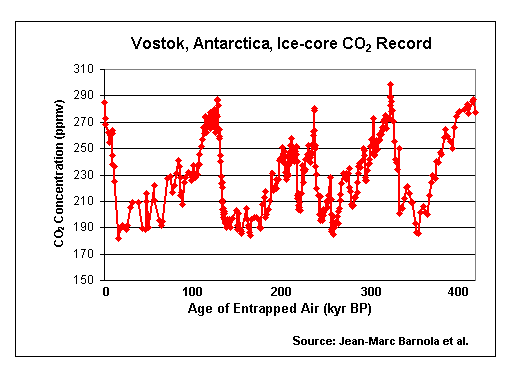
https://cdiac.ess-dive.lbl.gov/trends/co2/vostok.html
According to this over the entirety of the history of the arctic ice caps, which is hundreds of thousands of years, while CO2 and temperature have shown a consistent trend of synchronized movement, CO2 increases follow temperature increases and not the other way around. That means that correlation doesn’t equal causation when it comes to CO2 and temperatures, so higher CO2 numbers don’t lead to higher temperatures but the other way around.
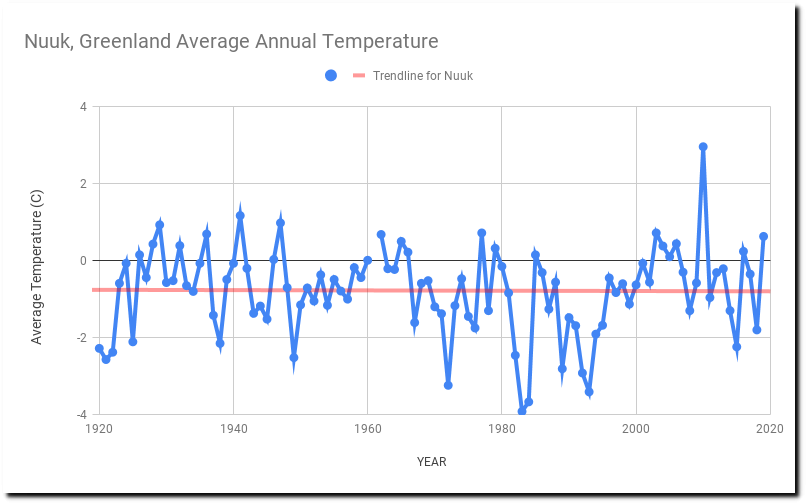
Climate alarmists (I call them that because they call those who independently study and question the data as “deniers”) often refer to Greenland’s temperatures as proof (another unscientific word) that temperatures are increasing. As you can see 0 indicates the all-time average temperature, while the red line shows the trend over the last 100 years. The average temperature is consistent and that consistency is unchanging, and it is even slightly below the all-time average by less than one degree. Remember – they tell us that a one degree change is disastrous but human activity as currently projected by even the alarmists isn’t even going to touch a whole degree of temperature change over the next 100 years even according to the most alarmist claims.
http://ossfoundation.us/projects/environment/global-warming/natural-cycle
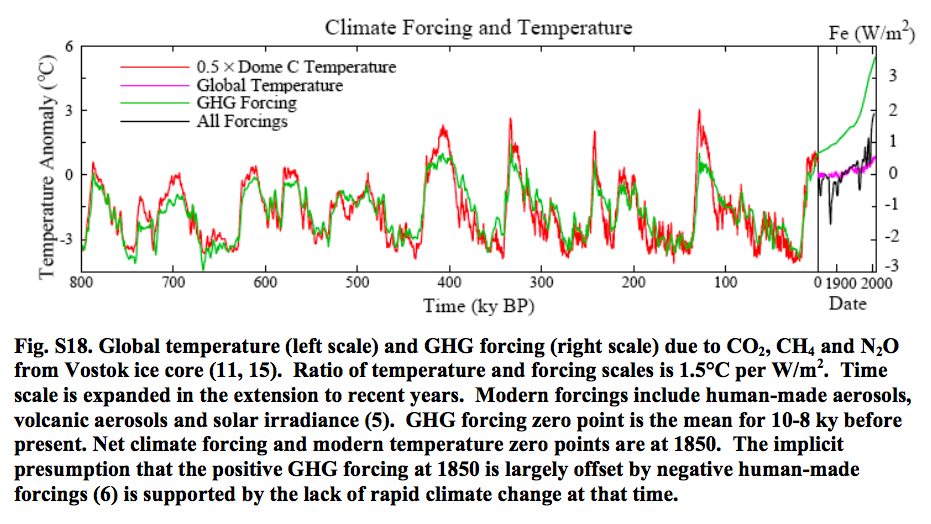
Right here is an example of the sorts of tricks they use – you only need to worry about the purple line which is the temperature – and as you can see – it is consistent with the trends over the past 800,000 years. Some other things are thrown in there such as vulcanic activity, solar activity, and greenhouse gases, but as we have established there is no positive correlation between a rise in CO2 and temperature, so it doesn’t make any sense to include that in this chart. It is designed to look scary and nothing more. If you read into what their definition is of “GHG forcing” it’s actually overcompensating for “Human induced changes in greenhouse gases” as if that translates into actual GHG emissions due to humans. It’s all based on some mumbo jumbo model instead of combining actual man made CO2 levels with non-man made CO2 in which case the green line would not spike like that as humans only account for 3% of C02 emissions even according to the loudest fearmongering voices when it’s probably closer to a fraction of a percent (not that it matters). And their “forcing” methodology assumes that there is a cumulative effect when you combine GNG forcing and solar radioactive forcing and volcanic forcing etc. and it’s a big mess of redundant information and it still doesn’t explain how CO2 contributes to temperature changes. They seem to think that they’ve demonstrated that CO2 causes higher temperatures because when you consider the impact of CO2 in combination with actual causes of temperature changes it looks as though CO2 has something to do with it when it really doesn’t. http://ossfoundation.us/projects/environment/global-warming/radiative-climate-forcing
NASA is very deceptive – https://climate.nasa.gov/evidence/
It starts of with “how do we know” instead of “do we know?” But aside from that, it uses examples that are cherrypicked to show the outcome that they want you to see – so they use charts that show CO2 emissions which are supposed to offer proof of warming – but where’s the warming? For that they give you charts on their website that show in comparison the recent cooling trends of the past 30 years as being small in comparison to the last 150 years, but why don’t they show you the same kind of chart for CO2 that goes all the way back 800,000 years? Because that chart would be like the third chart I posted above – showing that despite CO2 and other factors temperature trends haven’t changed, and if you go back beyond 1880 it doesn’t look as dramatic, because that would show to people that there is a cyclical trend beyond the period that they cherrypicked but they selectively chose the year in which the temperatures were at their lowest in recent history for their charts to look the way they want them to look.
https://climate.nasa.gov/blog/2893/nope-earth-isnt-cooling/
They link to this site which is like a brochure for how cool and important the stuff they do is regarding ice cores: https://icecores.org/about-ice-cores but I covered the relevance of the ice core data above where it suggests that CO2 has never in history of the arctic caused the temperatures to go up – so why should that change? Rather than discuss actual data they show you slideshows of pictures of their machines and tell you about all the ways they spend taxpayer money on “science.”
I wonder why they go out of their way to mislead non-scientifically-minded people about climate change? I guess this has nothing to do with it whatsoever: https://www.inc.com/maureen-kline/climate-change-a-26-trillion-growth-opportunity.html
-
AuthorPosts
- You must be logged in to reply to this topic.